Growing Seasons
Definitions
-
Degree-day = a unit of measurement that
is equal to one degree of temperature above or below a base temperature. A
degree-day is NOT a 24-hour period!
§ EXAMPLE:
if the base temperature is 40°F and
the mean daily temperature is 59°F, the
degree-day value = 19 degree-days
-
Growing Degree-days = for
a particular crop, a growing degree-day is a day in which the mean daily temp
is one degree above the base temperature of that particular crop. It is the
minimum temperature that a crop needs to grow.
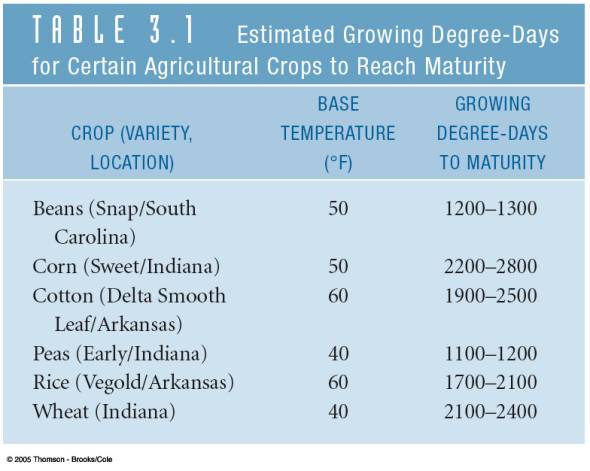
§ A
particular crop requires a certain number of growing degree-days during the
growing season to reach maturity. See figure below.
-
Heating degree-day = a
degree-day that is accumulated when the mean daily temperature is less than 65°F.
§ Power
companies use this as an estimate on how much energy to create based on the
assumption that people will turn on their furnaces when the mean daily temp
drops below 65°F. So it is mostly used
during cooler weather.
§ EXAMPLE:
if the mean daily temp = 23°F,
then 42 heating degree-days were acquired that day. (65-23 = 42)
-
Cooling degree-day = a
degree-day that is accumulated when the mean daily temperature is greater than 65°F.
§ Power companies use this as an estimate on how much energy to create based on the assumption that people will turn on their air conditioning when the mean daily temperature is above 65°F. So it is mostly used during warmer weather.
The
Histogram
-
The histogram is a graph with the abscissa (y-axis)
representing the frequency (or the number of times an event happens) and the
ordinate (x-axis) representing an interval of some value.
-
The y-axis is simply a count of the number of times a
certain event happens
-
The x-axis is a separated into bins, where each bin
represents a value interval that will classify event
-
OKAY enough with those definitions, maybe some examples
will help you understand
§ EXAMPLE
1. Seen the “Price is Right”? Well, playing the “Plinko” game can make a
histogram. Each time you drop a plinko chip it falls into a certain money slot
(bin). Every time you drop a plinko chip is a new event. Every time the plinko
chip goes into a bin, the frequency goes up. So, if I drop 5 plinko chips into the
$1000 bin, then there are five chips in there and the frequency value is 5.
§ EXAMPLE
2. 50 students take an exam and there is a large range of scores. To make a
histogram, divide the total range of scores up into intervals of 10% (each bin
=10% and this is the x-axis). Then divide up the score according to these bins.
Put all the scores that are between 50% and 59% in a bin and so forth. Once
they are all binned up, you can see the frequency of occurrence of a given
score range. If you add up all the frequency values in each bin you should get
the total number of students that took the exam. SEE EXAMPLE BELOW
For our class, we
looked at a histogram that represents the probability that a crop will reach a
certain number of growing degree-days based on first and last frost dates.
-
The
x-axis here is the growing degree-day bins
-
The
y-axis shows the percentage cases over the last 100 years that successfully
reached maturity for a given bin
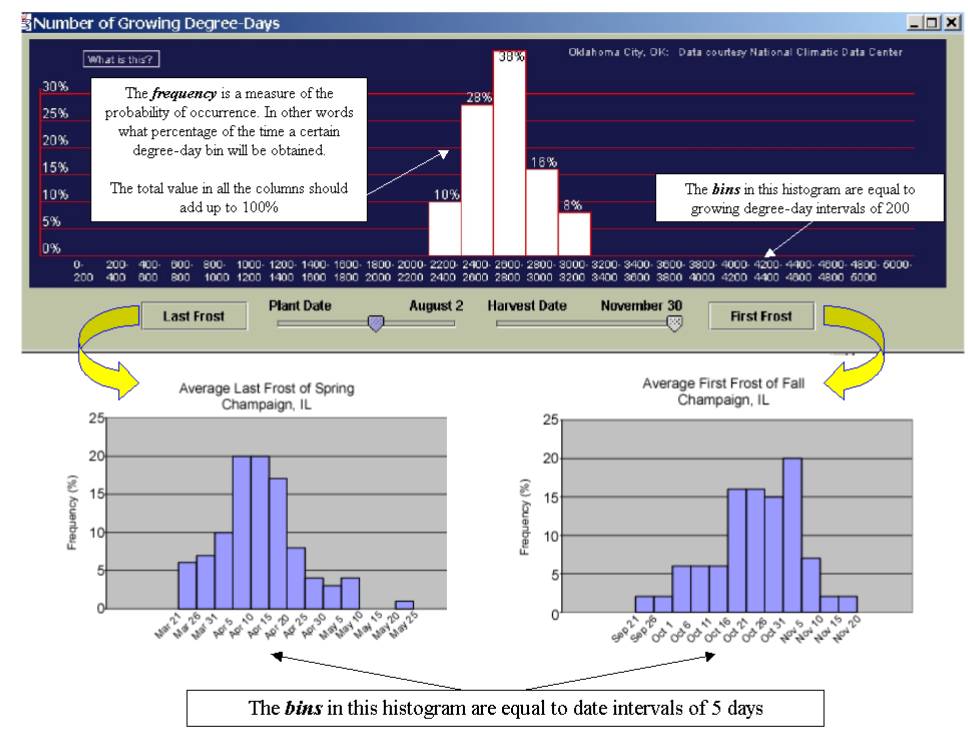
HOW TO READ:
-
Plant date = Aug 2 and Harvest date = Nov 30
o There
is a 10% chance that between Aug 2 and Nov 30, between 2000 and 2400 GGD will
be achieved
o There
is a 28% chance that between Aug 2 and Nov 30, between 2400 and 2600 GGD will
be achieved
o There
is an 8% chance that between Aug 2 and Nov 30, between 3000 and 3200 GGD will
be achieved
o There
is a 76% chance that between Aug 2 and Nov 30, less than 2800 GGD will be
achieved
o There is a 24% chance that between Aug 2 and Nov 30, more than 2800 GGD will be achieved
ANSWERS TO THE QUESTIONS ON THE LAST PAGE OF THE GROWING
SEASONS EXERCISE
1.
As you go north, the crop has to stay in the ground
longer. Why? Because typically temperature decreases as you go north.
Therefore, the mean daily temperature is typically less than a location to the
south. This means that fewer growing degree-days are accumulated over the
growing season
2.
Crops in Oklahoma City usually failed because of drought
and heat. The number of growing degree-days was often close to number needed to
reach maturity because droughts usually are worse later in the summer (that’s why
we planted early in Oklahoma City – to avoid drought/heat waves). In Billings,
MT there were many cases where very few growing degree-days were accumulated
because there were frequent late frosts and early frosts. This combined with
low mean temps made for a harsh environment to grow crops in.
3.
Oklahoma City, OK was the easiest to grow sunflowers in
because you could set the plant date past the last frost date and the harvest
date before the first frost date and still manage to get enough growing
degree-days for sunflowers to reach maturity. Billings, MT was the most
difficult because of the reasons stated in the previous two answers.
4.
Oklahoma City, OK had the largest problem with drought/heat
killing the crops because it is typical that during the second half of the
summer, a ridge develops over the central states and keeps cooler temperatures
to the north and wetter conditions to the east.
5.
Billings, MT had the most problems with killing crops
because of the harsh climate.
Hurricanes that have hit the US this season
Charlie, Frances and Ivan