| |
Hands-On, Minds-On Meteorology
Description
| Programming | Operation
| Condensation
Description
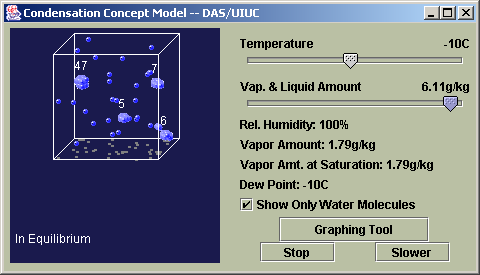
The Condensation program allows students to view a microscopic volume
of moist air and manipulate its temperature and water content to learn
more about condensation.
|
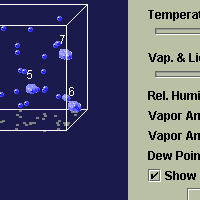
click for whole shot |
Objectives
The primary objective is to discover the relationship between temperature,
moisture, and relative humidity. A secondary objective is to use the
graphing tool to graph the classic saturation vapor pressure vs. temperature
graph.
Programming
Theory
The theory behind the Condensation tool is to take a very small (but
not measured) volume of air and view the dry air molecules, the water
vapor molecules, and liquid water found inside. Each particle (particle
is used here to include both types of molecules AND the liquid water)
has a mass and a velocity. They are then sent off to either collide
with the boundary of the volume, or to each other. Each water vapor
molecule added helps to calculate the moisture variables. The actual
movement depicted here is more for collisions and letting the condensation
/ evaporation process happen. The code for 3-dimensional collisions
is available in 3DCollisions. More information about the parcels themselves
can be found in ParcelSet*, so named because there are several versions
of parcel controlling programs. The sub-program used here is ParcelSetCond,
but they're all similar enough to be discussed in one document.
Assumptions
The Volume:
- The X direction is from left to right.
- The Y direction is from bottom to top.
- The Z direction is from back to front.
Graphics and Visualization:
- Each individual red 'ball' is one molecule of generic dry atmosphere
(Molecular Mass = 29.87)
- Each individual blue 'ball' is one molecule of water VAPOR (Molecular
Mass = 18.00)
- Each clump of blue 'balls' represents a condensed amount of LIQUID
water. (Molecular Mass = 18.00 * #molecules)
- The clump images are accurate up to clump sizes of ten, with clumps
larger than ten looking the same as those with ten.
- Numbers appear above large clumps (4 molecules or more) of condensed
water to help show their numbers.
Condensation Process:
Much of this is discussed in WaterCollisions, but the option to slow
down the molecules with the Slower button is unique to Condensation,
Lifting Air (Moist), and Evaporation. The primary difference in slow
mode is the time between each parcels next movement is slowed, but there
is a significant, but more subtly noticed difference as well. It comes
in the actual process of condensation. When the temperature or water
content is changed such that the RH exceeds 100%, existing water vapor
molecules will coalesce with any water type it comes into contact with,
thereby reducing the RH until it is back to 100%. Because we are dealing
with a small number of water vapor molecules, this process can take
too much time to occur in the program, so in the normal mode, every
time step that passes with the RH still larger than 100%, the search
radius each water vapor molecule uses to try to collide with another
piece of water increases by a pixel. The longer this takes, the more
a water vapor particle may seem to disappear out of thin air. Generally
this doesn't happen, and is so fleeting that it isn't that noticeable.
In slower mode, the search radius is not increased, so it takes longer
for the equilibrium condition to be satisfied, but this is acceptable,
as it is moving slower anyway.
Equations
See ParcelSet*
Other
See ParcelSet*
Operation
Running the Program
- Click the link for 'Condensation'.
- Change temperature and total vapor content by sliding the appropriate
scrollbar.
- Start and Stop the molecules by clicking the appropriate button.
- The Slower button toggles the speed mode. It is labeling what
would happen if you pressed it. (Ex.: If the button says "Slower",
the molecules are moving quickly and would move slower if the button
was pressed.
- Use the checkbox to toggle the visibility of the dry air molecules.
- This program will run better with the dry air molecules invisible.
- Enable the Graphing Tool by click
the appropriate button.
Extra Knowledge
N/A
 |
Department of Atmospheric Sciences
University of Illinois at Urbana Champaign
Created by Dan Bramer: Last Modified 07/27/2004
send questions/comments to bramer@atmos.uiuc.edu
|
|